Article by: Digital Marketing Institute
Many factors go into a successful website.
However, having a strong user experience is often overlooked, and it can impact how long visitors stay on your site, whether they buy from you (or your competitors), and how well your site ranks in search engines.
In this post, we’ll cover what Core Web Vitals are and how you can optimize them to improve the performance and user experience of your website.
What are the Core Web Vitals?
The Core Web Vitals (CWV) consist of three user experience metrics that measure the loading, interactivity, and visual stability of a web page.
Optimizing your Core Web Vitals improves the speed of your web pages and their SEO ranking in search engines like Google.
Google’s upcoming Page Experience update, which is due for release in summer 2021, rewards sites that offer a great user experience, with a strong focus on high performing CWV metrics.
So, what are the Core Web Vitals, and what thresholds do you need to meet?

The Largest Contentful Paint (LCP) metric measures the loading performance of a web page. Google considers a good LCP score to be 2.5 seconds or less.
The First Input Delay (FID) metric measures the interactivity of a web page. To provide a good user experience, Google recommends an LCP score of 100ms or less.
The Cumulative Layout Shift (CLS) metric measures the visual stability of a web page. Google considers a CLS score of 0.1 or less as good.
How to Measure Core Web Vitals
Google provides several online tools that can measure Core Web Vitals.

The two most user-friendly are Search Console and PageSpeed Insights.
Search Console only supplies field data: meaning aggregated real-life visitors to your website (if Google has enough information on them) and from the last 28 days. At the same time, PageSpeed Insights supplies both field and lab data.
Field data is critical because it’s what Google uses in its Core Web Vitals assessment and Page Experience ranking signal.
That said, because field data is calculated over a historical 28-day period, it’s difficult to use for optimization. However, Lab data is generated in real time, and when a page speed test is run, so it’s a better source of data when trying to optimize and improve page speed scores.
Therefore, if you plan to optimize your website for CWV and want to see instant feedback that things are improving, you’ll benefit from paying more attention to lab data.
Here’s a PageSpeed Insights screenshot for the example.com domain:

In the top left of the screenshot, you’ll see the results default for a mobile device. The example.com website has very little content and has a performance score of 100% for both mobile and desktop.
The Core Web Vitals assessment and Page Experience ranking signal both relate to your mobile scores (rather than desktop), so you’ll want to focus on that more.
You can see that Largest Contentful Paint and Cumulative Layout Shift appear in both field and lab data. However, First Input Delay, a Core Web Vital, only appears as field data.
That’s because First Input Delay relies on a person interacting with a web page and can’t be replicated in a lab environment. That said, Total Blocking Time is a lab-basic metric that mimics First Input Delay and can be considered an equivalent metric.
Interestingly, Google has hinted that all three Core Web Vitals must be in the good threshold to qualify for a Page Experience ranking boost.
If you see a green circle next to your Core Web Vitals scores, your web page is in the good threshold. An orange square means it’s not too far away from a good score but needs improvement, according to Google. And a red circle means your score is considered poor and some way off the good threshold.
Okay, so before we dive deeper into each of the three Core Web Vitals and how you optimize them, I want to talk about one other page speed metric that is extremely important but often forgotten.
Time to First Byte
Time to First Byte (TTFB) aka server response time is a metric that measures the time for the first byte to travel from a web server to the web browser. It indicates how responsive a web server is to a request.

Google says:
A faster server response time directly improves every single page-load metric. Before anything else, improve how and where your server handles your content. Use Time to First Byte (TTFB) to measure your server response times.
So, if you want to improve your Largest Contentful Paint, First Input Delay or any page speed score for that matter, you’ll want to optimize and bring down your TTFB or server response time score.
If your server response time is 600ms or more, it will get flagged in the “opportunities” section of a Google PageSpeed Insights report.

If your website scores under 600ms, you’ll find it under the “passed audits” section.

However, if your web page passes Google’s server response time threshold, but it’s above 200 ms, this is still a key area to improve because it will benefit all other page speed metrics later down the line.
Many webmasters believe a poor server response time is due to a slow web server that hosts a website. This is partly true, so upgrading your web host could improve your server response times.
But it’s also to do with how you manage scripts that are run from your web server. These include programming scripts like PHP, which provide function to your web pages, and SQL scripts like MySQL, which query a database.
So, having bloat-free code can go a long way to improving your server response times and page speed scores.
If you want more on this, I wrote a post about how managing scripts are the hidden ingredient for a lightning-fast Google PageSpeed Score.
Now, let’s dive even deeper for the first Core Web Vital.
Core Web Vitals #1: Largest Contentful Paint
The Largest Contentful Paint (LCP) metric reports the time taken between the First Contentful Paint (FCP), which is the first visual element of a web page seen by the user, right up to when the largest element of a web page has been fully loaded.
The LCP element is either an image or text block and is shown before a user scrolls. It marks the point when the main content has likely been loaded.

After running a PageSpeed Insights test, the Largest Contentful Paint element is reported in the “diagnostics” section:

If the LCP element is an image, which is more often the case (compared to a text block), here are some things that you can do to improve your LCP score:
- Compress the image to a smaller file size before uploading
- Further compress the image within the web server (so, before the image is downloaded to the web browser)
- Serve images in next-gen formats like JPEG 2000, JPEG XR, and WebP, or as SVGs where appropriate
- Preload the LCP image element
- Disable lazy-loading of LCP image
Whether the LCP is an image or text block, it can be further enhanced by improving the Time to First Byte (TTFB) score.
Core Web Vitals #2: First Input Delay
The First Input Delay (FID) metric measures how long it takes the browser to respond to the first interaction from the user.
A lower FID score indicates that a web page is likely to be usable, and used quickly.
FID is a field metric that cannot be simulated in a lab environment. So, an equivalent lab-based metric is Total Blocking Time.
When a user requests a web page, network requests like JavaScript and CSS are downloaded and processed on the main thread of the web browser:

Long JavaScript requests processed on the main thread are common culprits that lead to high FID scores.
Here are some ways to improve FID:
- Break up long JavaScript requests into smaller requests (requires high JavaScript skills)
- Defer or delay non-critical JavaScript requests from being loaded (this can be very effective at lowering FID scores and sometimes straightforward using a page speed plugin like WP Rocket for WordPress)
- Improving the Time to First Byte (TTFB) score
- Route users to a nearby CDN
- Apply page and browser caching
- Compress JavaScript and CSS
Core Web Vitals #3: Cumulative Layout Shift
The Cumulative Layout Shift (CLS) metric measures the visual stability of a web page. And according to Google, a low CLS score helps ensure that a page offers a delightful user experience.
Have you ever visited a web page and tried to click on a link but suddenly the page’s layout moves, and you click on the wrong part of the page?
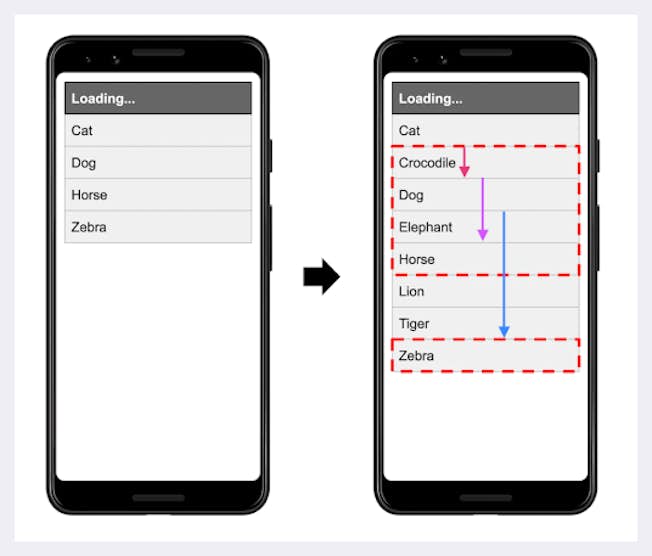
If you have, there’s a high chance the page was suffering from a poor CLS score, and it makes for a bad user experience.
CLS can vary from a major shift like when you click on an advert instead of the top menu of a website to very minor when you notice the fonts on a web page are very quickly replaced by another font.
Here are some things you can do to improve your CLS scores:
- Include size attributes for image and video elements (e.g. <img height=”370″ width=”428”).
- Ask a web developer to fix content shifts flagged in PageSpeed Insights.
- Restrict CSS animations of properties that trigger layout changes.
Wrapping Up
Optimizing CWV can improve the user experience, SEO ranking, and perceived load speed of your web pages.
You may be able to improve your CWV scores on your own through a page speed plugin, or you may need the experience of a more technical person. For example a web developer or technical SEO.
In this article, there are several links from the web.dev website, a fantastic free resource created by Google. If you’d like to explore at a deeper level, the site contains some excellent resources on Core Web Vitals.
If your web pages fail the Core Web Vitals assessment, you are not alone, because Google has set the bar very high. However, Google also stated that the Page Experience ranking signal, which includes Core Web Vitals, will start as a comparatively low strength ranking factor.
That said, higher Core Web Vitals scores will become an SEO ranking factor soon, and it’s been proven that faster loading websites convert more visitors into sales.